App and PC Software
The Co.S.A. controller is not just a hardware device, but a true digital ecosystem. Interfacing with PCs and mobile devices allows for rapid adjustment and deep performance analysis.
PC Software (Windows)
The desktop software is primarily designed to view the delivery curve trend and to adjust parameters more quickly than the PowerBox Joystick.
Connection and Initial Setup
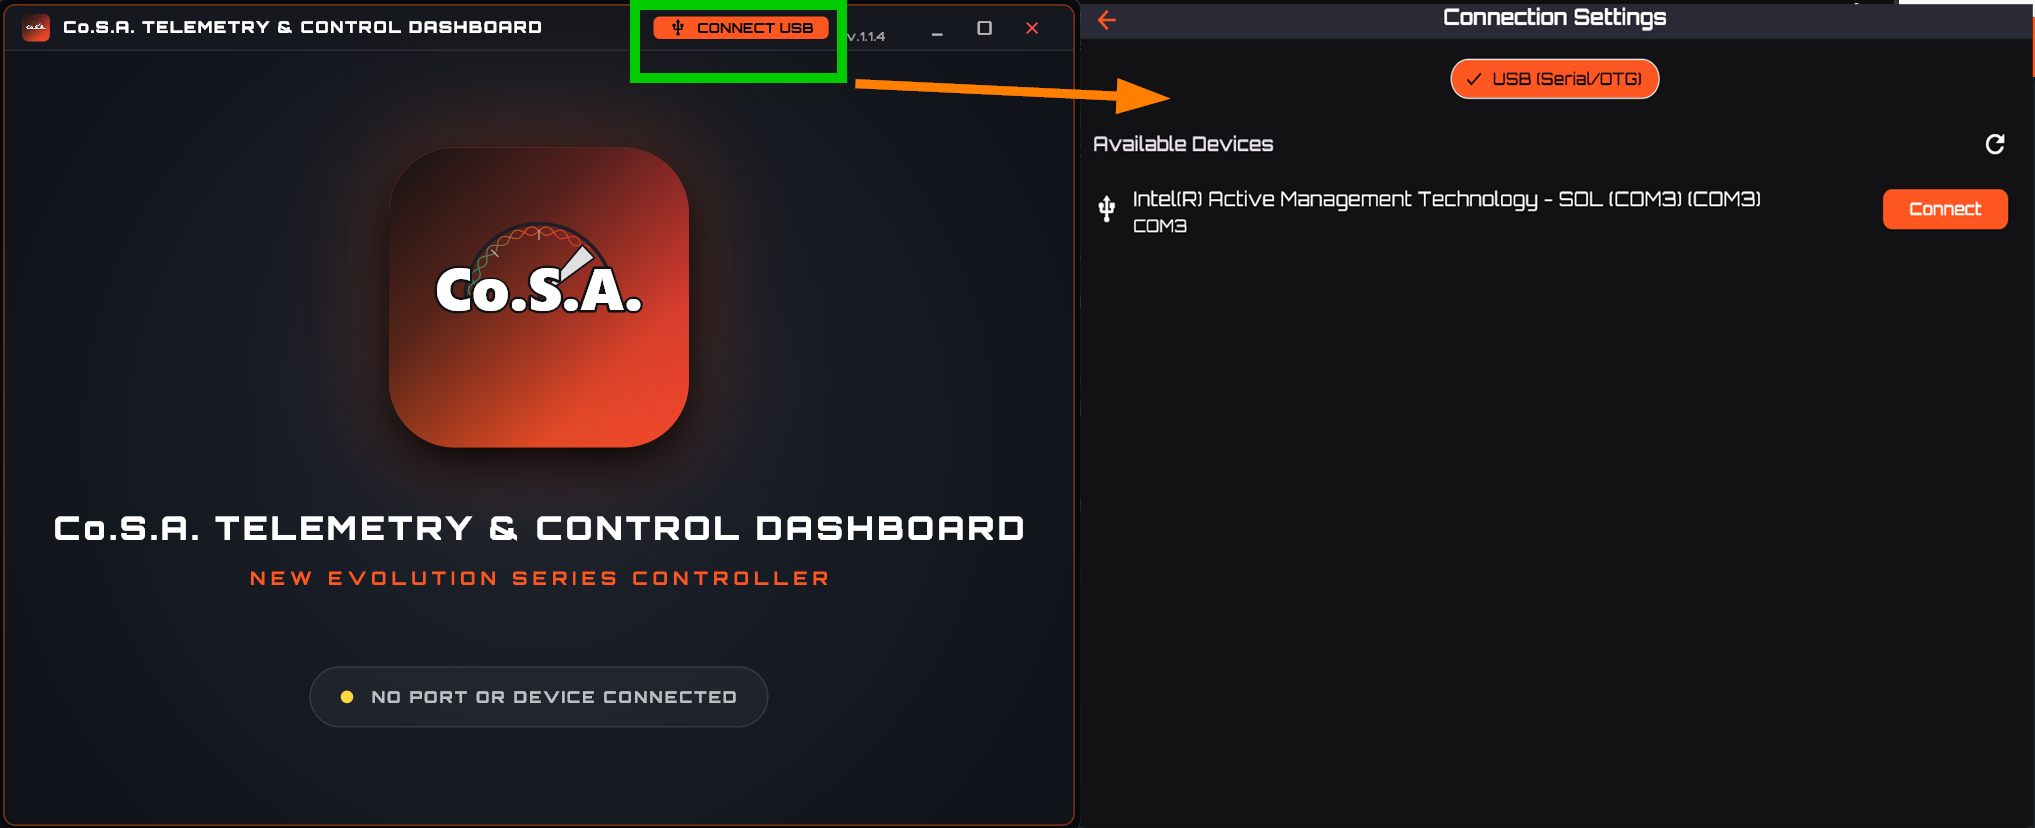
- Connect the PowerBox to the PC via USB cable. (If not recognized, install CH340 drivers).
- Open the CoSA application.
- On the connection page, ensure USB (Serial/OTG) is selected (on Windows/Android).
- Find your controller in the "Available Devices" list and press Connect.
- The application will automatically set the correct Baudrate and read current parameters from the control unit.
Maps Modification (Curves)
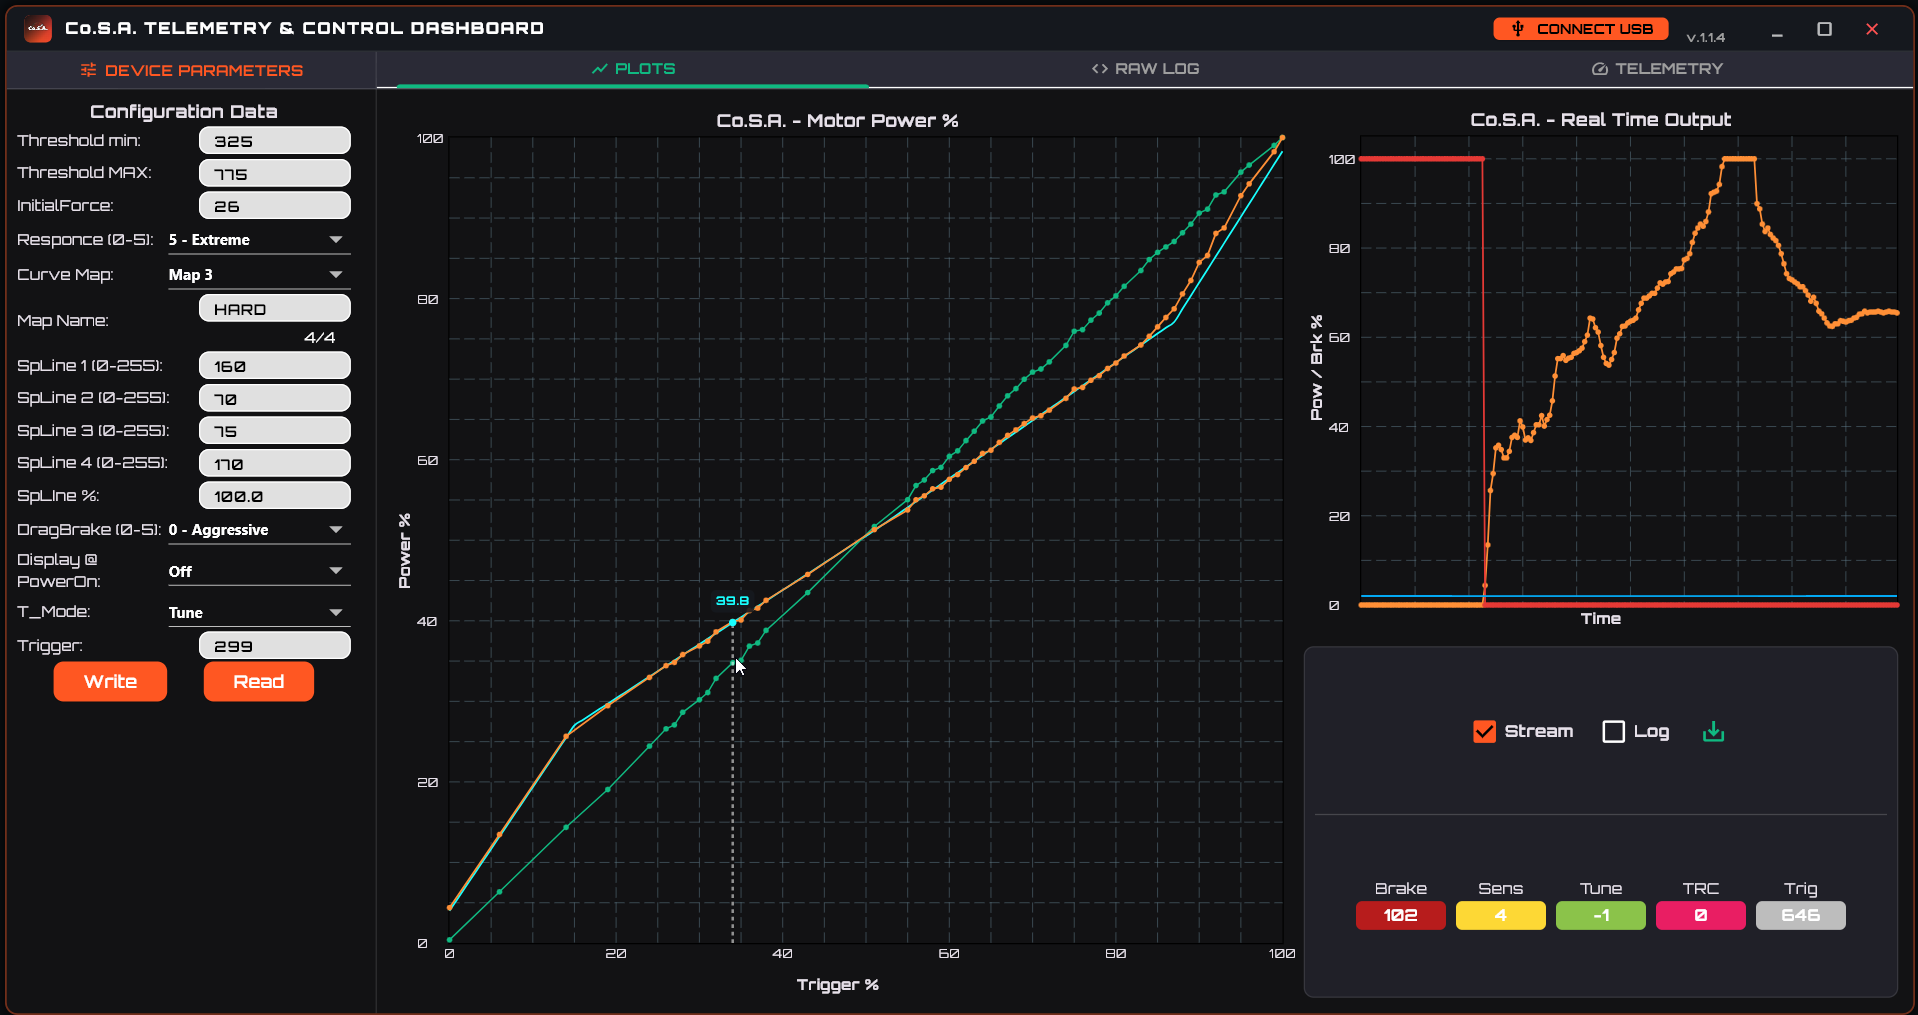
The left graph shows the curve trend. To modify a map from the PC:
- Write the new values in the
SPLine 1,2,3,4boxes. (The total % of the curve will appear automatically). - Press Write setting. Attention: Remember to position the hardware potentiometers at the central "click", especially the Tuning, to avoid discrepancies between the shown graph and the real output!
The right graphs are useful for studying the effect of anticipated braking and the interaction between trigger and motor response in real time.
Firmware Update
You can also keep the controller updated from the PC Software:
- Move to the Communication tab.
- Press the Update FW button.
- Select the updated firmware file (
.hex.enc). - Confirm with Yes.
- Once finished (COMPLETED!), press Ok, then Disconnect and Connect again. The new version will appear at the top.
Android App (Extended versions only)
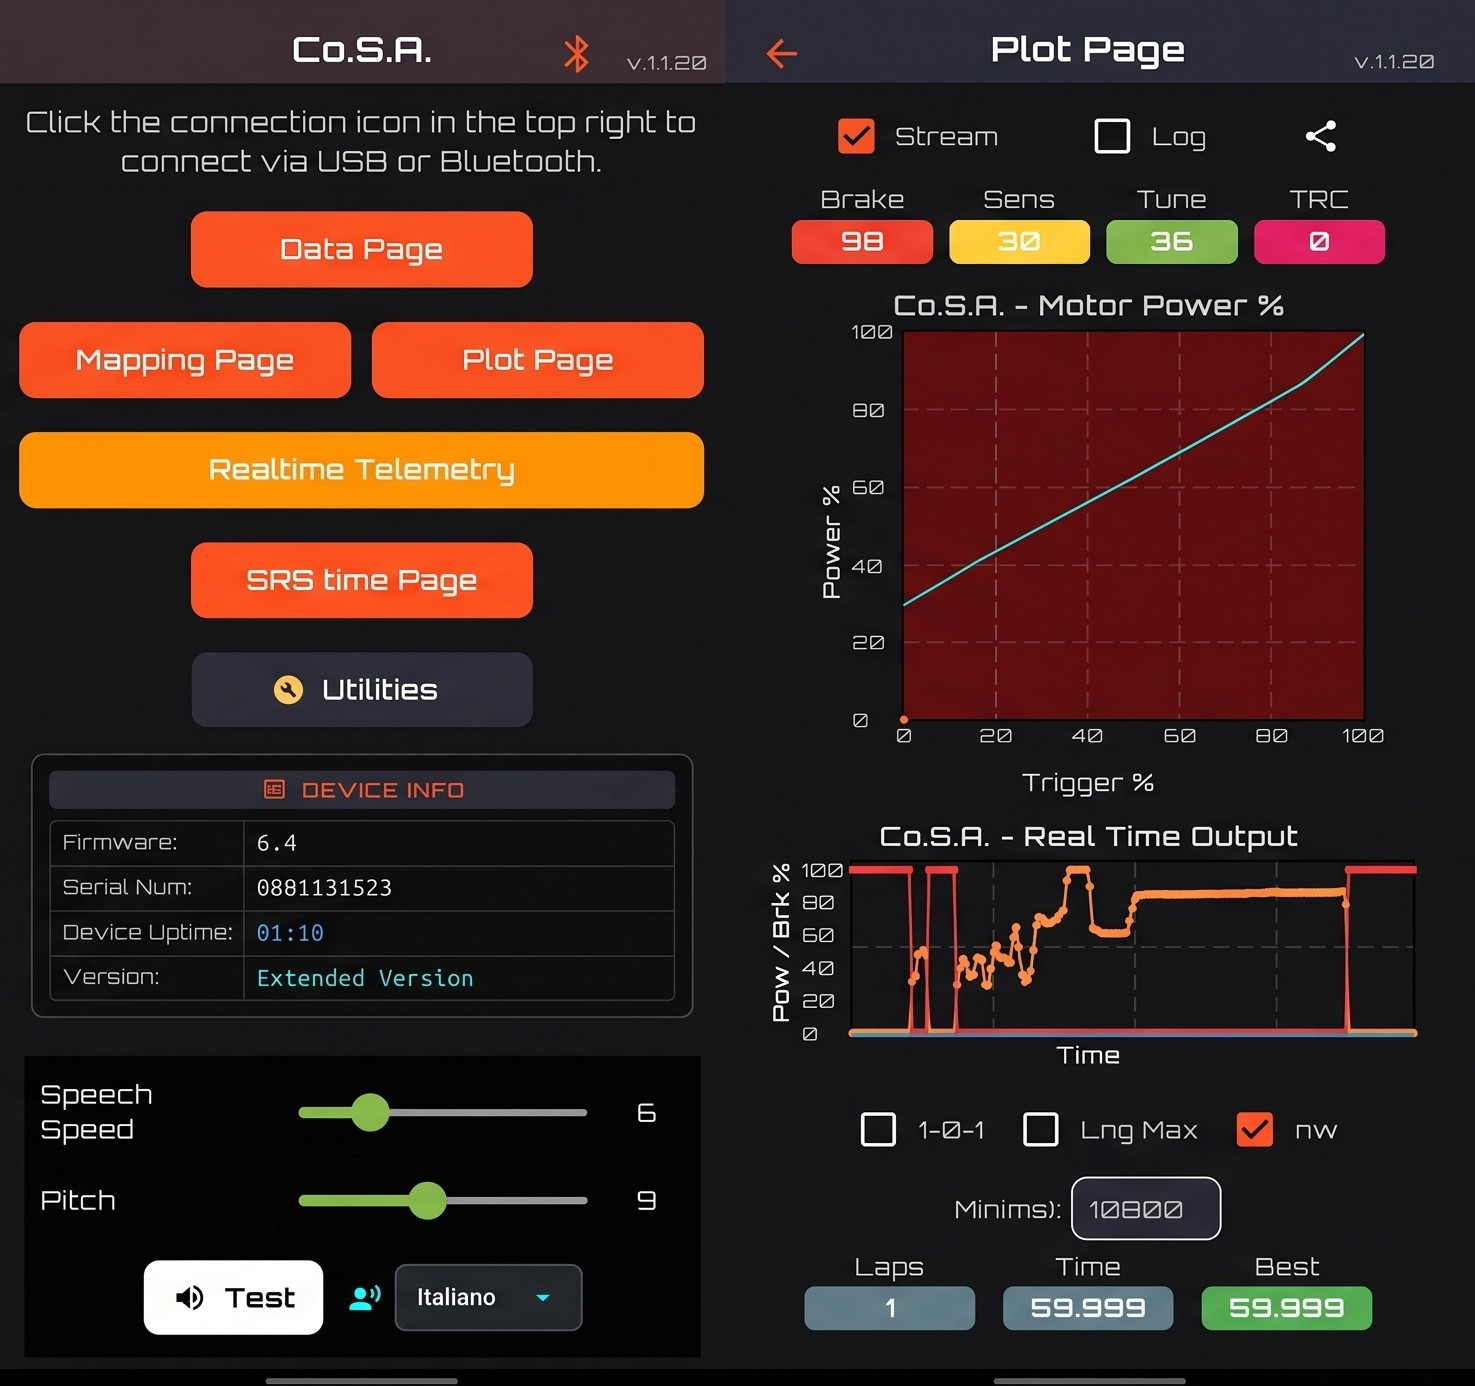
The Android app (requires OTG support) replicates all the features of the PC Software and the hardware display, introducing exclusive features designed for track use without the bulk of a laptop.
Main Pages
- Home / Configuration: Replicates the display menus, allowing all parameters (Thresholds, Maps, DragBrake, etc.) to be set in a fast and intuitive touch interface.
- PlotPage (Graphics): Shows the curve trend in real time (by checking the appropriate box at the top). It allows you to drive while analyzing the data log for later study.
Real-Time Mapping
Through the app, in the Mapping section, you can use convenient on-screen sliders to deform the response curve in real time and immediately save it in the controller.
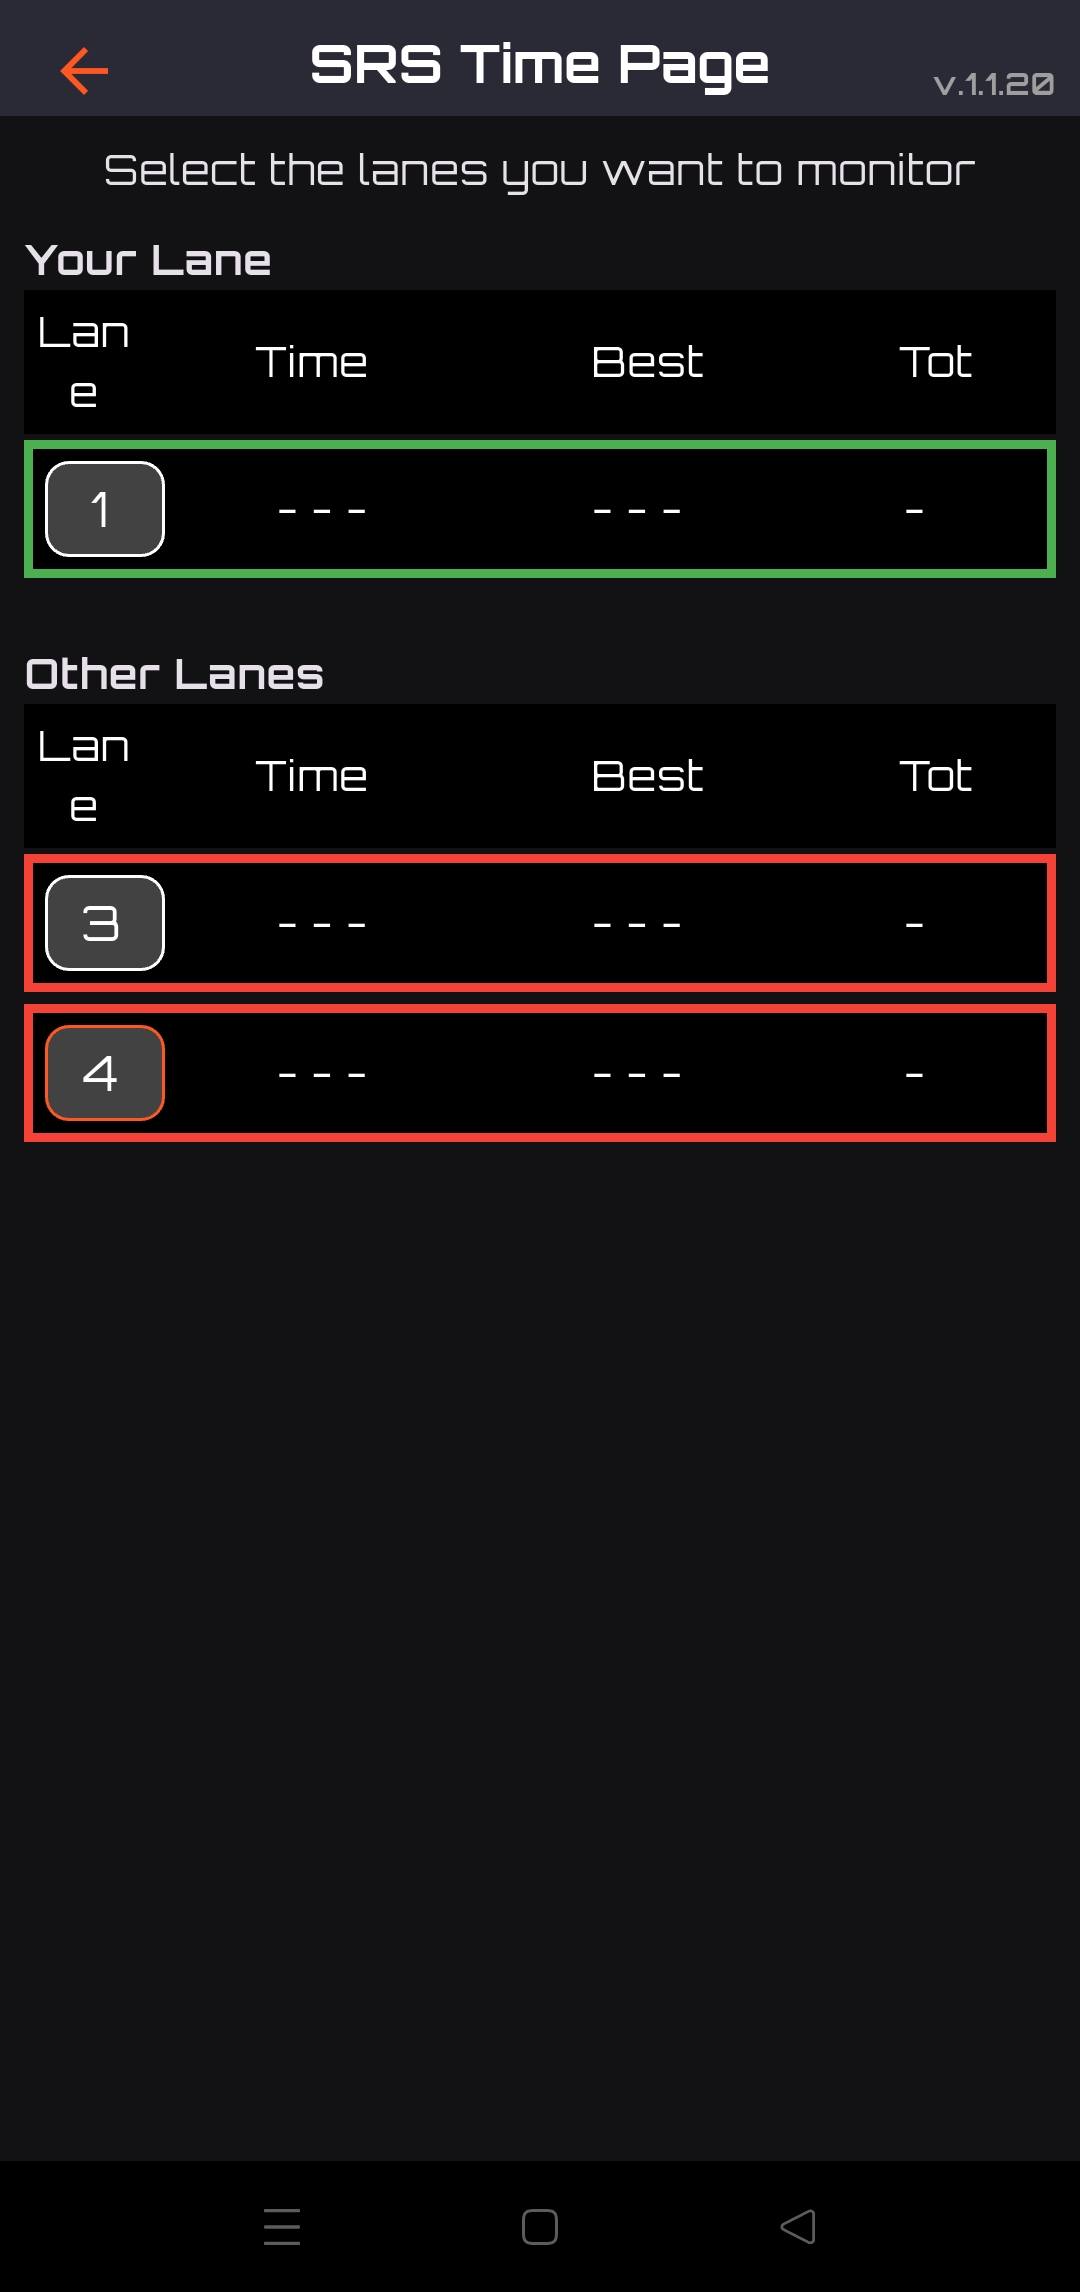
Lap Times and Statistics (Beta)
The great innovation of the mobile app is the integration of a stand-alone timing system: By setting an estimated minimum time and an error percentage (in the SRS Time page), the app can derive the lap time by analyzing the delivery and braking peaks, communicating it via audio feedback in headphones!